Investigating Windows System Resource Usage Monitor (SRUM)
11/03/2022 Friday
The Windows System Resource Usage Monitor (SRUM) was first introduced in Windows 8. SRUM tracks 30 to 60
days of system resource usage, particularly application's resource usage, energy usage, Windows push
notifications and network connectivity, and data usage. This feature is enabled by default and configured to
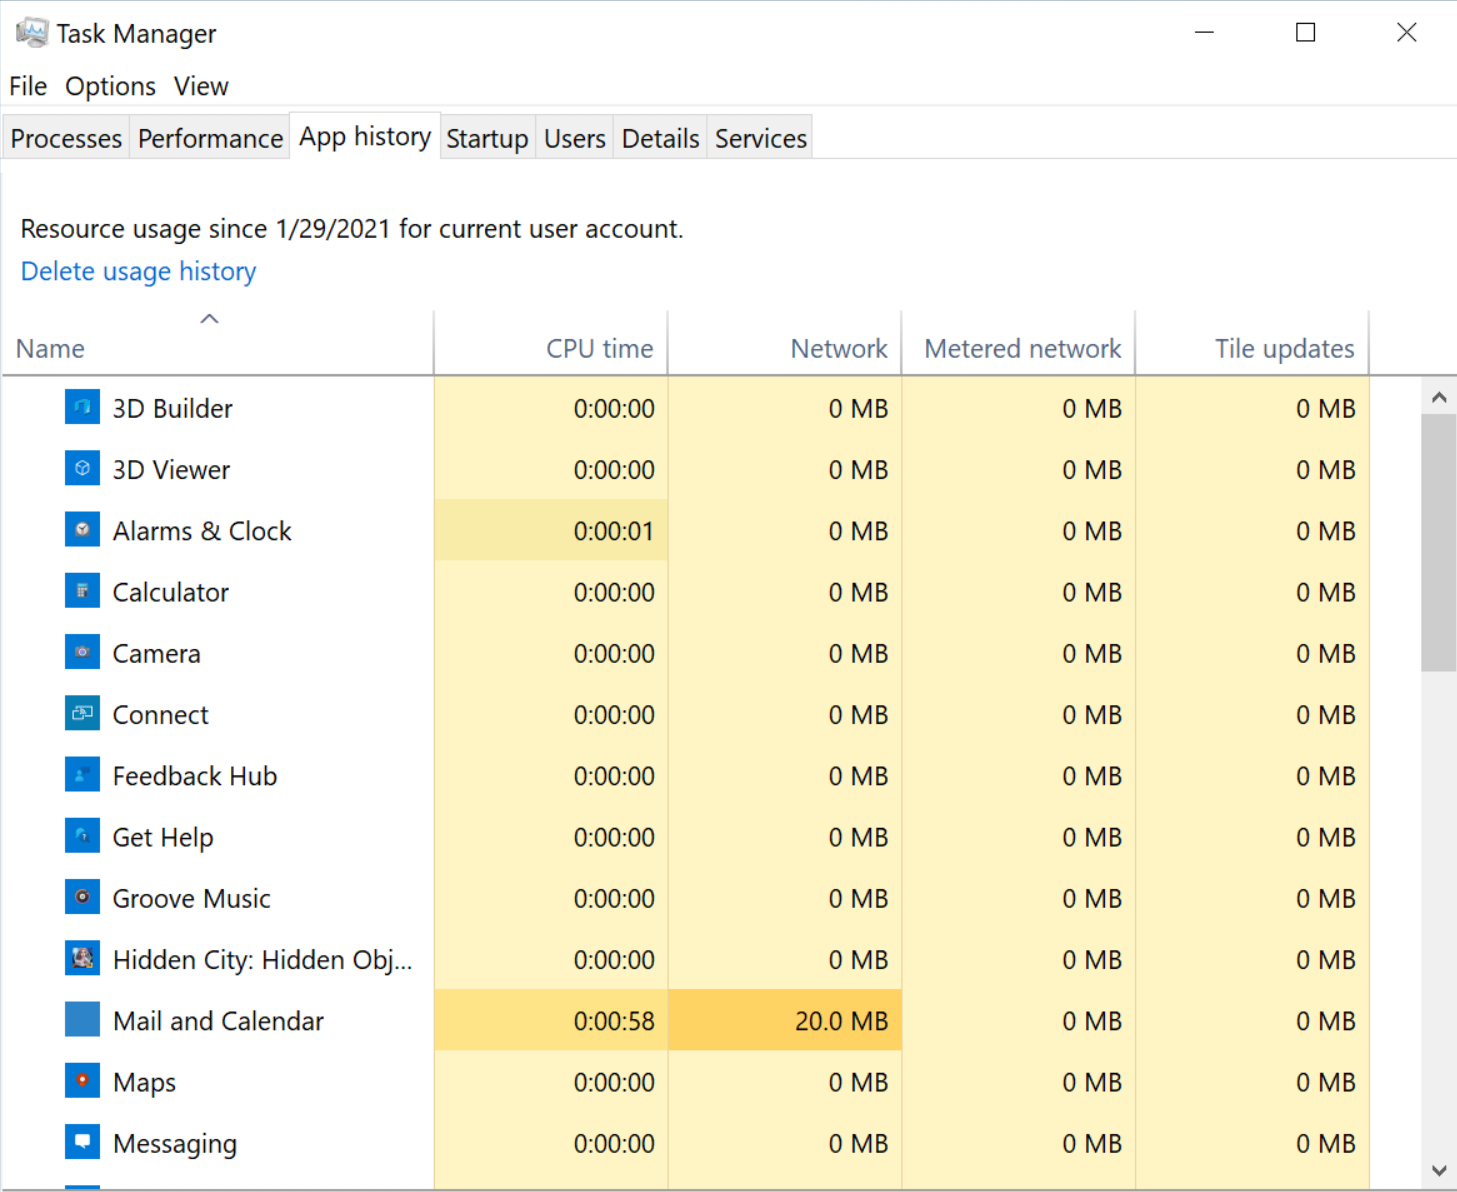
start automatically upon system startup. Some of the data collected is available to the user on Windows 8
and later versions through the “App history” tab on the Task Manager; however, the database associated with
SRUM contains a wealth of information that is not visible to the end user.
Digital Forensics Value of SRUM Artifacts
SRUM is considered a gold mine of forensic information, as it contains all the activities that occur on a particular Windows system. SRUM tracks and records program executions, power consumption, network activities, and much more information that can be retrieved even if the source has been deleted. This type of information enables the examiner to gain insights into the previous activities and events on a system.
Location of SRUM Artifacts
SRUM artifacts are stored in a file named SRUDB.dat at C:\Windows\System32\SRU\SRUDB.dat
Structure of SRUM Artifacts
SRUM artifacts are stored in an Extensible Storage Engine (ESE) database format. This database file contains multiple tables recoding all the activities that occurred on a particular system.
Analyzing SRUM Artifacts with ArtiFast Windows
This section will discuss how to use ArtiFast Windows to extract SRUM artifacts from Windows machines and
what kind of digital forensics insight we can gain from the artifacts.
After you have created your case and added evidence for the investigation, at the Artifact Parser phase, you
can select SRUM artifacts:
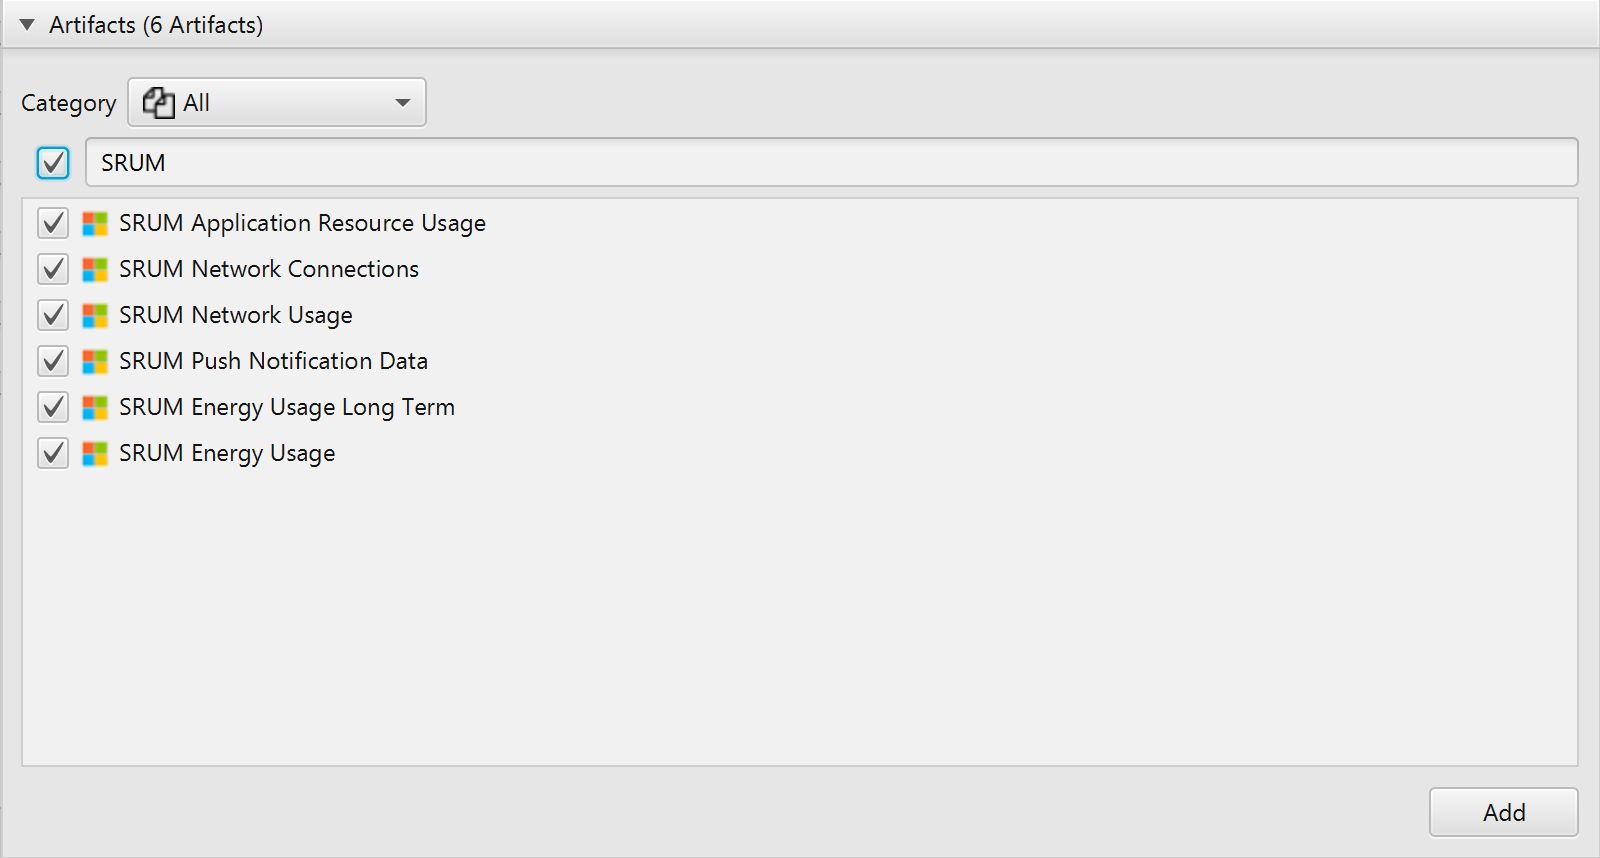
ArtiFast can analyze SRUM Application Resource Usage, Energy Usage, Energy Usage (Long Term), Network
Connections, Network Usage, and Push Notification Data. For demonstration purposes, all the artifacts have
been chosen but you have the option to select only one or more artifacts.
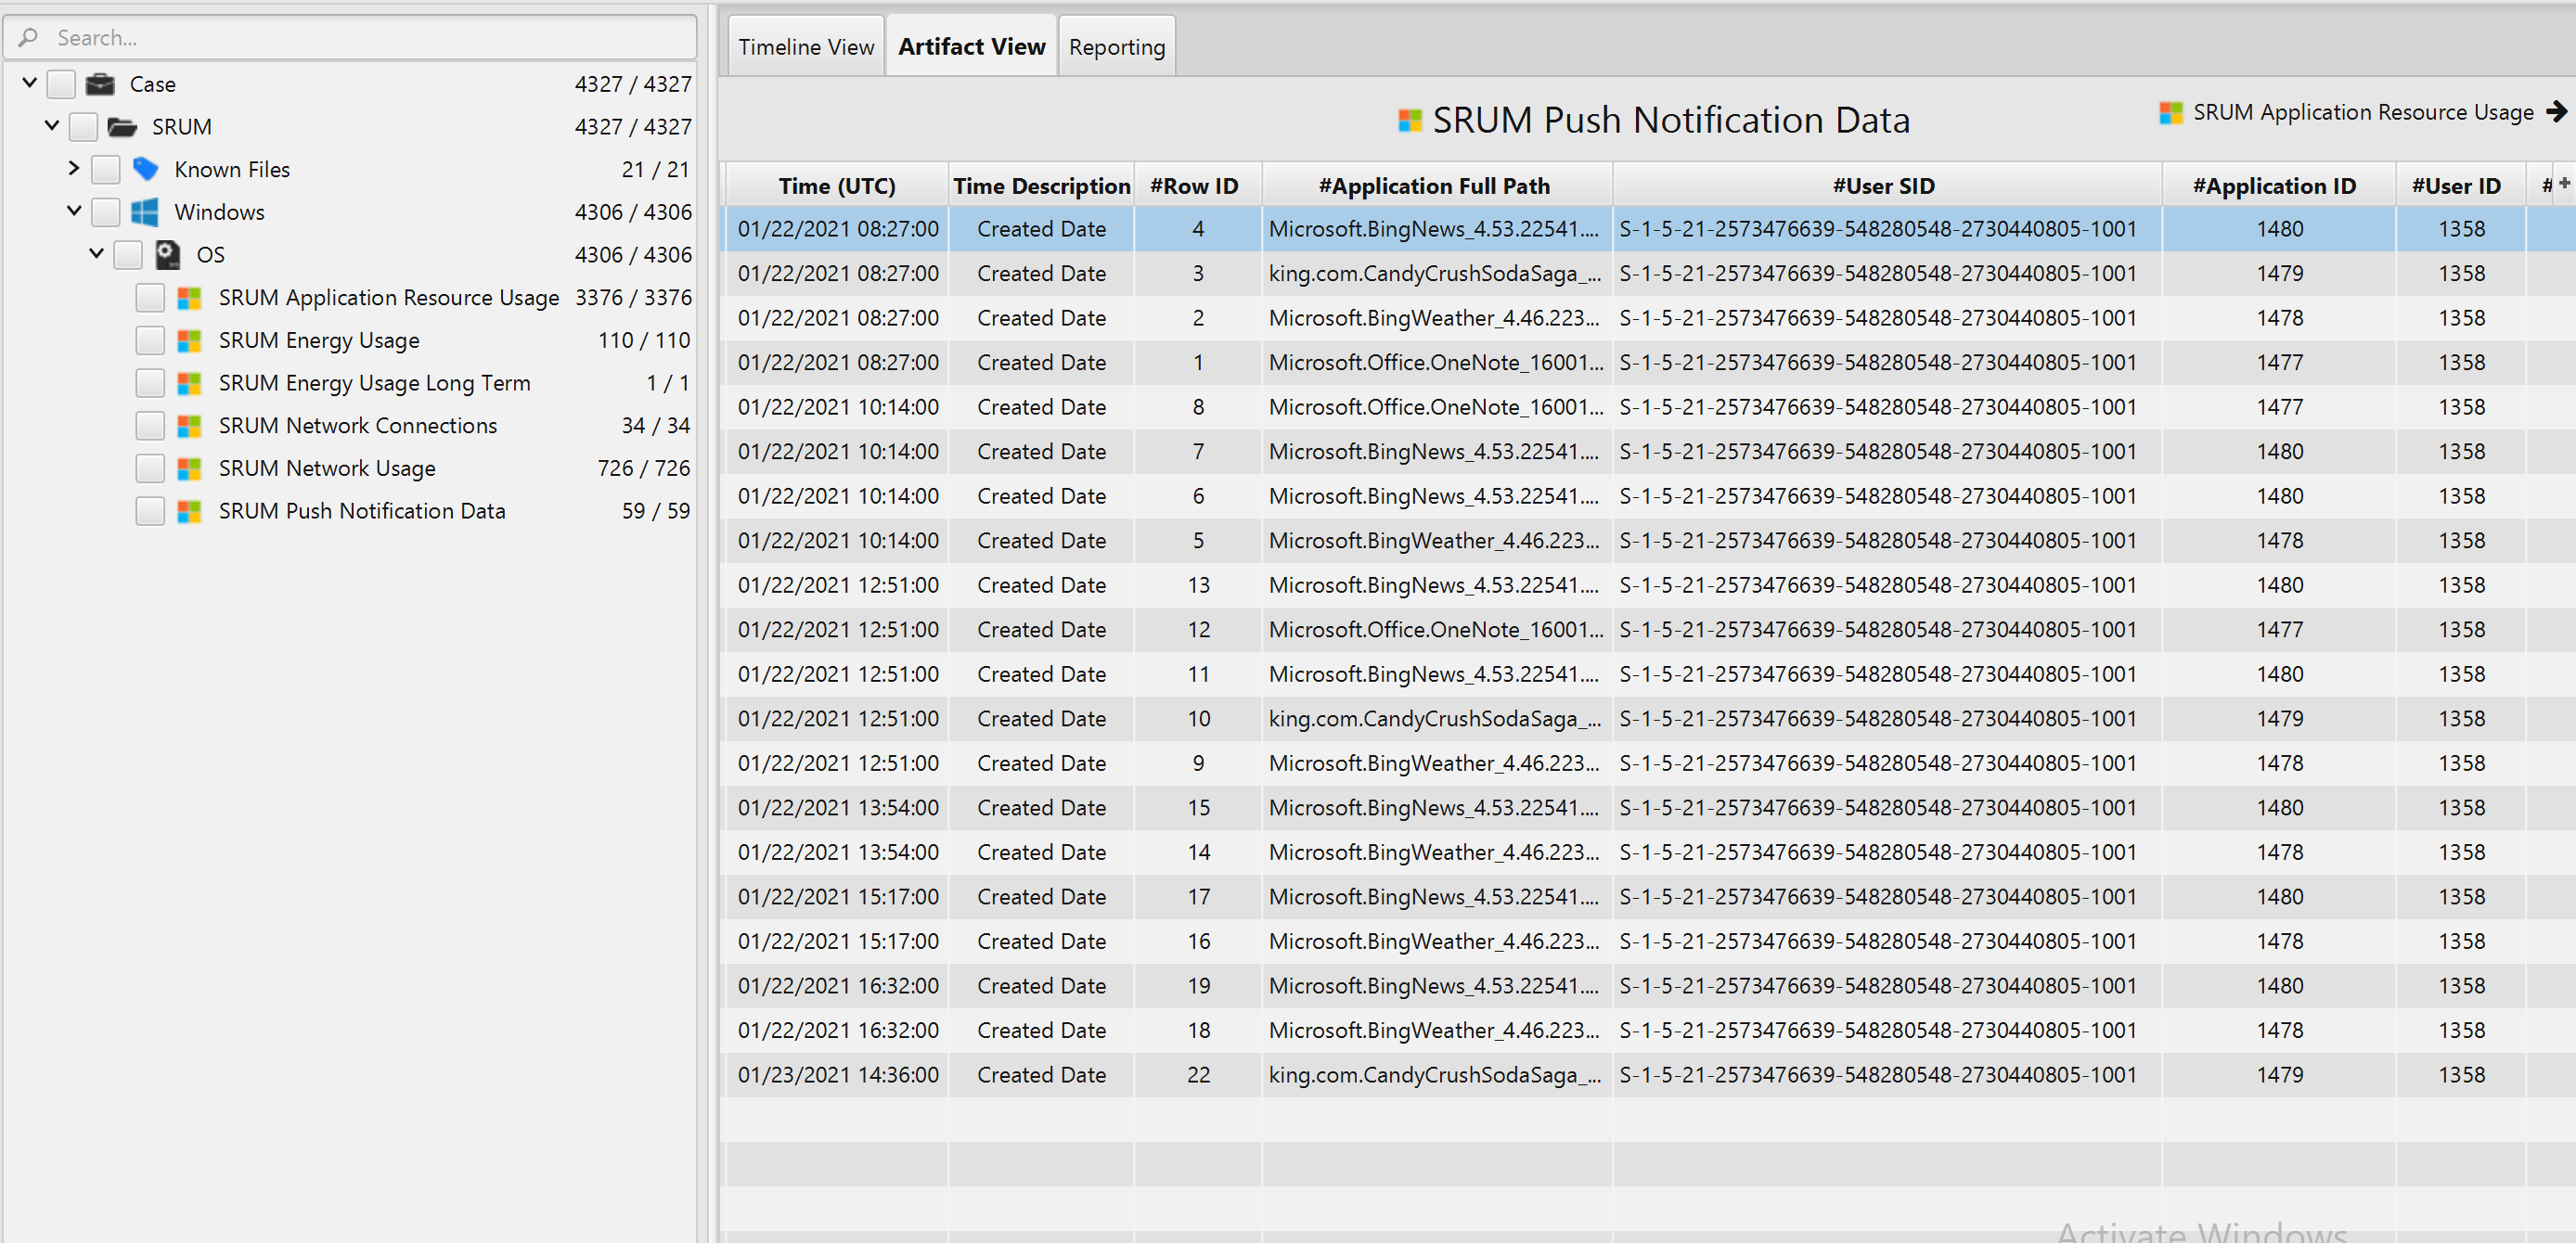
Once ArtiFast parser plugins complete processing the artifact for analysis, it can be reviewed via “Artifact View” or “Timeline View,” with indexing, filtering, and searching capabilities. Below is a detailed description of SRUM artifacts in ArtiFast software.
SRUM Application Resource Usage Artifact
This artifact contains information related
to the application's resource usage. The details you can view include:
- Application Full Path - The full path to the application.
- Application ID - Application ID.
- Background Bytes Read - Number of background bytes read.
- Background Bytes Written - Number of background bytes written.
- Background Context Switches - Indicates the number of background context switches.
- Background Cycle Time - Background cycle time.
- Background Num Read Operations - Number of background read operations.
- Background Num Write Operations - Number of background write operations.
- Background Number Of Flushes - Number of background flushes.
- Created Date - Date/Time when the entry was created in the database.
- Foreground Bytes Read - Number of foreground bytes read.
- Foreground Bytes Written - Number of foreground bytes written.
- Foreground Context Switches - Indicates the number of foreground context switches.
- Foreground Cycle Time - Foreground cycle time.
- Foreground Num Read Operations - Number of foreground num read operations.
- Foreground Num Write Operations - Number of foreground num write operations.
- Foreground Number Of Flushes - Number of foreground number of flushes.
- Row ID - The row ID.
- User ID - User ID.
- User SID - Security Identifier of the user running the application.
SRUM Energy Usage Artifact
This artifact contains information related to power
consumption on a Windows device. The details you can view include:
- State Transition - Indicates the type of state transition.
- Row ID - The row ID.
- Full Charged Capacity - Indicates the full charged capacity of the device.
- Event Date - Date/Time when the event occurred.
- Designed Capacity - The initial designed capacity of the device.
- Cycle Count - Indicates the amount of power consumption by a battery throughout its lifetime.
- Created Date - Date/Time when the entry was created in the database.
- Charge Level - The device’s charge level.
SRUM Energy Usage (Long Term) Artifact
This artifact contains information related to
power consumption (long term) on a Windows device. The details you can view include:
- Active AC Time - Active AC time.
- Active DC Time - Active DC time.
- Active Discharge Time - Active Discharge time.
- Active Energy - Active Energy amount.
- CS AC Time - CS AC time.
- CS DC Time - CS DC time.
- CS Discharge Time - CS Discharge time.
- CS Energy - CS Energy amount.
- Created Date - Date/Time when the entry was created in the database.
- Cycle Count - Indicates the amount of power consumption by a battery throughout its lifetime.
- Designed Capacity - The initial designed capacity of the device.
- Full Charged Capacity - Indicates the full charged capacity of the device.
- Row ID - The row ID.
SRUM Network Connections Artifact
This artifact contains information related to the
networks the device connected to and the duration it stayed connected. The details you can view include:
- Connection Duration - Indicates the amount of time the device was connected to the network (in seconds).
- Connection Start Date - Date/Time when the connection to the network initiated.
- Created Date - Date/Time when the entry was created in the database.
- Interface Type - Indicates the interface type.
- Row ID - The row ID.
SRUM Network Usage Artifact
This artifact contains information related to the
networks activity. The details you can view include:
- Application Full Path - The full path to the application.
- Application ID - Application ID.
- Bytes Received - Indicates the number of Bytes received.
- Bytes Sent - Indicates the number of Bytes sent.
- Created Date - Date/Time when the entry was created in the database.
- Interface Type - Indicates the interface type.
- Row ID - The row ID.
- User ID - User ID.
- User SID - Security Identifier of the user running the application.
SRUM Push Notification Data Artifact
This artifact contains information related to
Windows push notifications. The details you can view include:
- Application Full Path - The full path to the application.
- Application ID - Application ID.
- Created Date - Date/Time when the entry was created in the database.
- Network Type - Type of network.
- Notification Type - Type of network notification.
- Payload Size - Indicates the size of the payload.
- Row ID - The row ID.
- User ID - User ID.
- User SID - Security Identifier of the user running the application.
For more information or suggestions please contact: asmaa.elkhatib@forensafe.com
